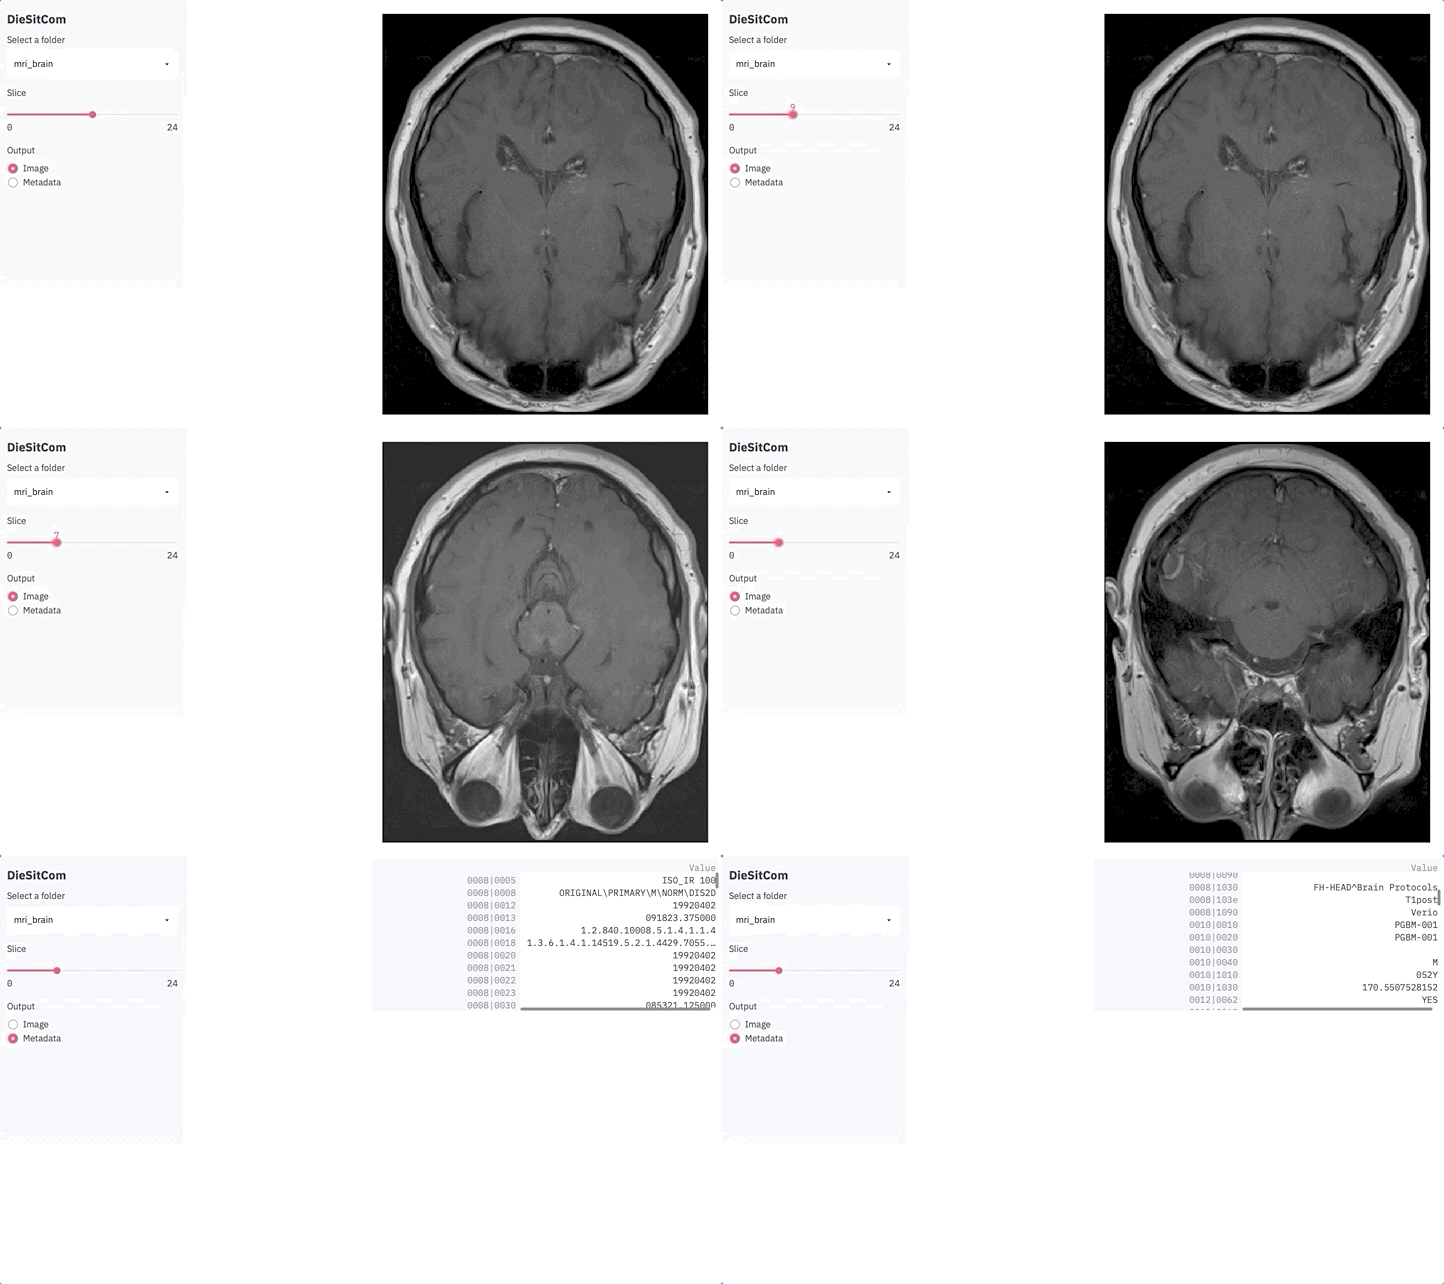
DieSitCom - A minimal Streamlit-based viewer for DICOM data

DICOM another file
There are two kind of (neuroimaging) people in this world: those who like the NIFTI format, and those who lie. Jokes aside, it is quite common for many neuroimagers to deal with the endpoint of the acquisition pipeline, to the point that not everyone has dealt directly with what actually comes out of an MRI scanner, data in DICOM format. But at some point, that time comes: for one reason or another, dcm2niix does not give us everything we need, and we need to go back to the source. But do we really want to look for a software to handle DICOM data and install it? Probably not. But there is good news: with ITK (and specifically SimpleITK), reading data and metadata from a DICOM folder is a matter of just a few lines of code. While we are at it, we may as well make a dashboard out of it!
In this post, I will show how to put together that dashboard using Streamlit, so guess what, we are doing that in 50 lines of code! As in most cases one may be interested in some obscure parameter hidden in the DICOM header, we will make sure that both the images and the metadata are accessible. This example and the related requirements are on the NeuroSnippets repository.
Don’t count your DICOMs before they are read
We can recycle some of the code written for the skull-stripping dashboard. As in that example, we need first to import the relevant packages and define two functions, one for selecting the input and the other for plotting:
import os
import matplotlib.pyplot as plt
import pandas as pd
import streamlit as st
import SimpleITK as sitk


def dir_selector(folder_path='.'):
    dirnames = [d for d in os.listdir(folder_path) if os.path.isdir(os.path.join(folder_path, d))]
    selected_folder = st.sidebar.selectbox('Select a folder', dirnames)
    if selected_folder is None:
        return None
    return os.path.join(folder_path, selected_folder)


def plot_slice(vol, slice_ix):
    fig, ax = plt.subplots()
    plt.axis('off')
    selected_slice = vol[slice_ix, :, :]
    ax.imshow(selected_slice, origin='lower', cmap='gray')
    return fig
The functions are slightly different from the skull-stripping dashboard: instead of looking for NIFTI files, we are looking for folders (and we will need to handle the case where a given folder is not DICOM-related) once again embedding a dropdown menu within the function; in terms of plotting, this time the function is shorter as we do not need to handle overlays.
The next block of code, that is also the last one (*already!?*), deals with defining the objects we need and inter-connect them:
st.sidebar.title('DieSitCom')
dirname = dir_selector()

if dirname is not None:
    try:
        reader = sitk.ImageSeriesReader()
        dicom_names = reader.GetGDCMSeriesFileNames(dirname)
        reader.SetFileNames(dicom_names)
        reader.LoadPrivateTagsOn()
        reader.MetaDataDictionaryArrayUpdateOn()
        data = reader.Execute()
        img = sitk.GetArrayViewFromImage(data)

        n_slices = img.shape[0]
        slice_ix = st.sidebar.slider('Slice', 0, n_slices, int(n_slices/2))
        output = st.sidebar.radio('Output', ['Image', 'Metadata'], index=0)
        if output == 'Image':
            fig = plot_slice(img, slice_ix)
            plot = st.pyplot(fig)
        else:
            metadata = dict()
            for k in reader.GetMetaDataKeys(slice_ix):
                metadata[k] = reader.GetMetaData(slice_ix, k)
            df = pd.DataFrame.from_dict(metadata, orient='index', columns=['Value'])
            st.dataframe(df)
    except RuntimeError:
        st.text('This does not look like a DICOM folder!')
Once again, streamlit offers a great example of how quick is it to put together a simple but functional dashboard. In less than 30 lines of code, we are doing the following:
- creating all the objects we need - a
title, asliderand aradiobutton (all of these in thesidebar), apyplotcontainer for the figure, and finally adataframecontainer for the metadata; - when any folder name is selected through the function
dir_selector(), the DICOM data and metadata are read usingSimpleITK; - we use the
sliderto select the slice of interest, and theradiobutton to choose if we are interested in the actual images or in the metadata; - we embed most of what I just listed in a
try/exceptblock to avoid error messages whenever the dropdown menu ends up on a non-DICOM folder.
Now we have to find some DICOM to test it!
DICOM Island
Publicly available DICOM data are not easy to find, but we are in luck: on the dash-vtk repository (that also provides an amazing example to use Dash for 3D rendering of DICOM data leveraging VTK) there are some sample DICOM datasets, including a brain. To retrieve the data, we can clone the repository or, to download directly that specific folder, we can use svn:
svn checkout https://github.com/plotly/dash-vtk/trunk/demos/data/mri_brain
It’s time for streamlit:
streamlit run diesitcom.py
