The skull-strip club: quick visual skull-stripping with FSL BET and Streamlit

You can leave your brain on
One of the first steps almost every neuroimaging pipeline has to do is skull-stripping, to free the brain from its cage and start doing registration, segmentation, *insert here any processing you are into* , the list is long. There are many tools to accomplish that, I personally use FreeSurfer and despite the associated time cost (FastSurfer may be a solution though) I am happy about it. Regardless of your method of choice, when we need a way to quickly skull-strip a brain and we do not have a trained neural network handy, we still turn to the good ol' FSL and fire BET up. In my experience, most of the times it will just work. When it doesn’t, you may need to change the fractional intensity threshold - that will unfortunately require some trial and error: bet -f 0.4, fsleyes, “Still not good enough”, bet -f 0.45, fsleyes, “Argh, almost there!". How can we make this whole process smoother? Did anyone say dashboard?
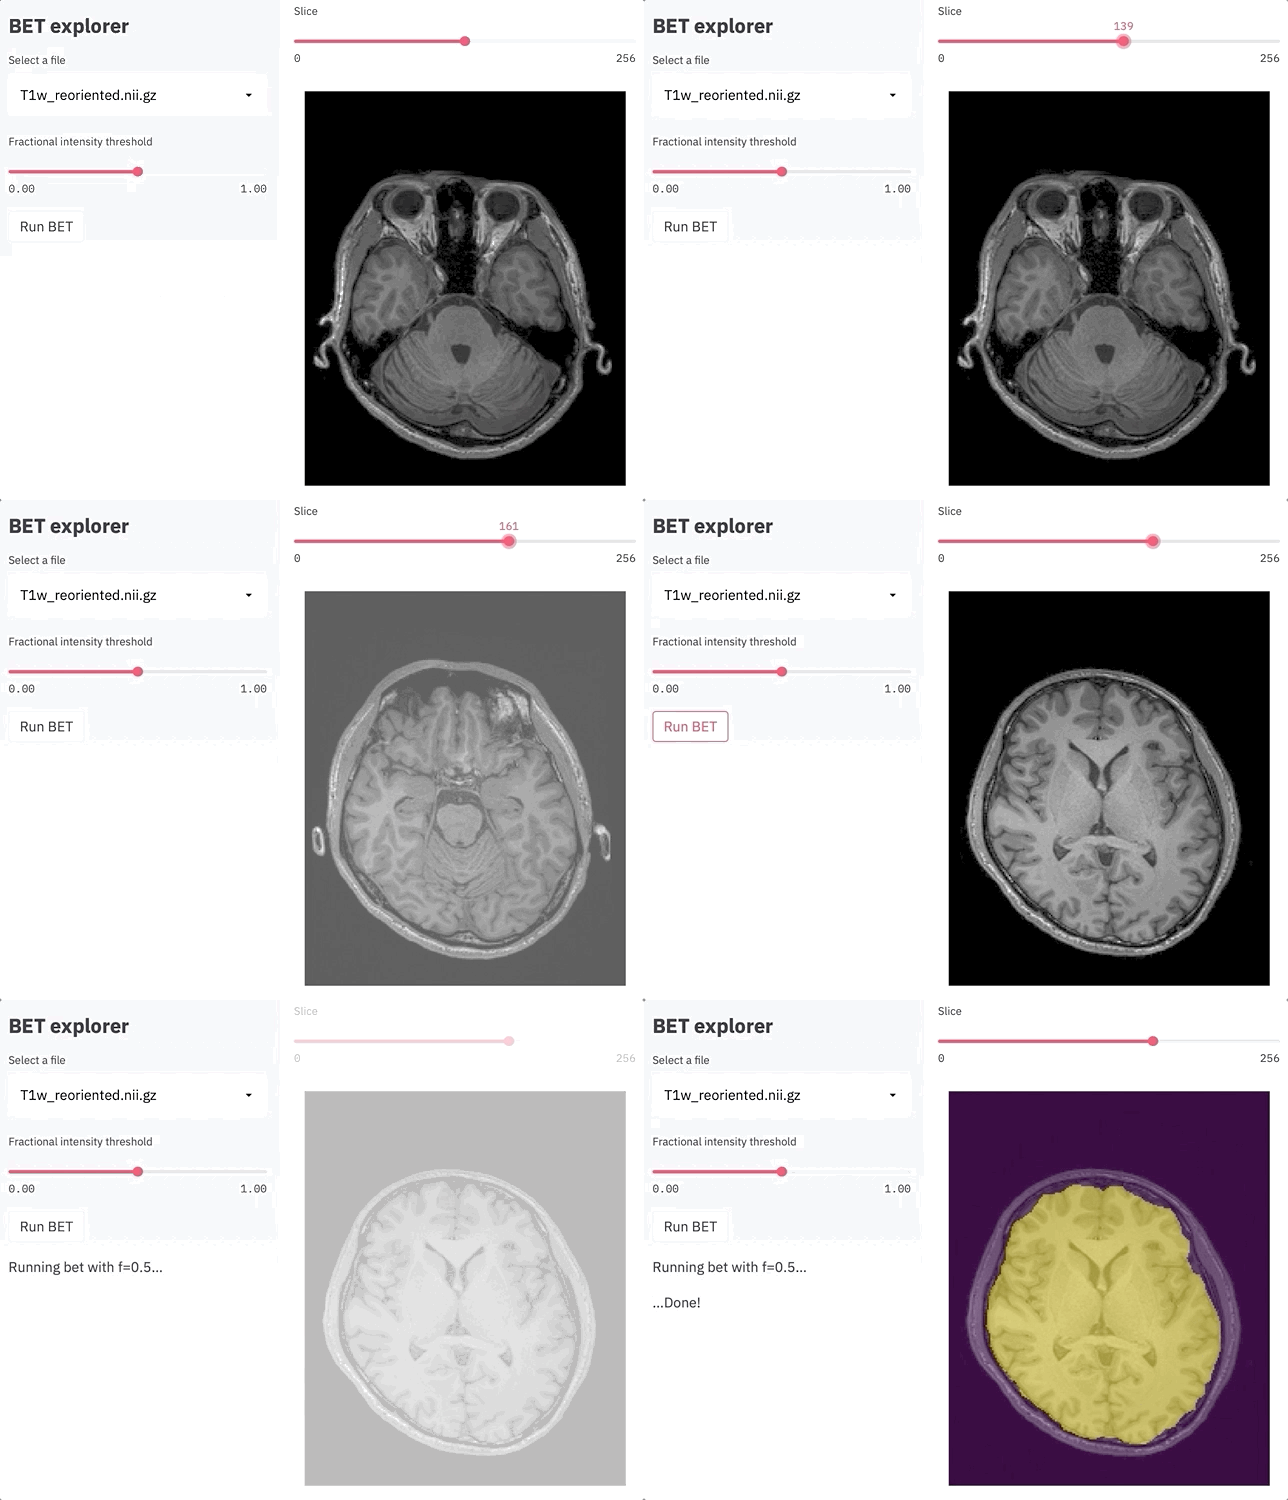
In this post, I will show how to make a suitable dashboard for this scenario in less than 50 lines of code with the amazing Streamlit. As we will see, the most amazing thing about Streamlit is how few lines of code are needed to turn a simple script in an actual dashboard. This example and the related requirements are on the NeuroSnippets repository (together with some tips if you want to run Streamlit on Colab or Binder).
Strip fast, rest young
Let’s start from importing the necessary packages and defining a couple of functions:
import nibabel as nib
import numpy as np
import streamlit as st
import matplotlib.pyplot as plt
import os


def file_selector(folder_path='.'):
    filenames = [f for f in os.listdir(folder_path) if f.endswith(".nii") or f.endswith(".gz")]
    selected_filename = st.sidebar.selectbox('Select a file', filenames)
    if selected_filename is None:
        return None
    return os.path.join(folder_path, selected_filename)


def plot_zslice(vol, overlay, z):
    fig, ax = plt.subplots()
    plt.axis('off')
    zslice = vol[:, :, z]
    ax.imshow(zslice.T, origin='lower', cmap='gray')
    if os.path.exists(overlay):
        mask = nib.load(overlay)
        mask_data = mask.get_fdata()
        if mask_data.shape == vol.shape:
            zslice = mask_data[:, :, z]
            ax.imshow(zslice.T, origin='lower', alpha=0.5)
    return fig
In the first function, we are using our first streamlit component: a selectbox, placed in the sidebar. Embedding the selectbox within a function is a quick way to make a tailored dropdown menu, in our case to select files with extensions nii or gz from a given folder. The second function does not do any streamlit magic, but takes care of creating a plot of a given slice from our MRI volume, and if an overlay volume exists (the brain mask, as we will see very shortly), it plots also that one on top of the actual image, with some transparency.
Let’s continue with more streamlit goodness:
st.sidebar.title('BET explorer')
filename = file_selector()
threshold = st.sidebar.slider('Fractional intensity threshold', 0.0, 1.0, 0.5)
overlay = 'brain_mask.nii.gz'
The title and slider components are exactly what we expect: a title and a slider, respectively. The slider component is quite interesting, as every time we interact with it, the value of threshold will change, and everything else depending on it will be updated without needing any additional code. We also create the selectbox we mentioned through the function we defined.
It’s time to see how all these objects interact with each other:
if filename is not None:
    img = nib.load(filename)
    img_data = img.get_fdata()

    if st.sidebar.button('Run BET'):
        st.sidebar.write(f'Running bet with f={threshold}...')
        st.spinner(text='In progress...')
        os.system(f'bet {filename} brain.nii.gz -m -f {threshold}')
        st.balloons()
        st.sidebar.write('...Done!')

    zlen = img_data.shape[2]
    z = st.slider('Slice', 0, zlen, int(zlen/2))
    fig = plot_zslice(img_data, overlay, z)
    plot = st.pyplot(fig)
Once filename has a legal value, we will load the related data using nibabel. Then we have a quite dense nested if statement: not only we define a button component in the sidebar, but we also declare that once it is pressed, bet will be run - since we used the -m parameter, a brain mask (named brain_mask.nii.gz) will be also created. To keep track of the progress, we are also using some messages, the spinner component (which will show up in the upper right corner), and, icing on the cake, the balloons component (you need to try it to appreciate it!). And that’s it, less than 50 lines of code!
Just show me the brain (and the balloons!)
It’s time to take this dashboard for a spin. For this example, I chose the Deep Image Reconstruction dataset shared by Shuntaro Aoki and colleagues on OpenNeuro, but as it is just a matter of finding T1-weighted data, basically you can pick almost any dataset. As usual, we can download the data through DataLad:
datalad install https://github.com/OpenNeuroDatasets/ds001506.git
datalad get -J 4 ds001506/sub-01/ses-anatomy/anat/sub-01_ses-anatomy_T1w.nii.gz
Let’s make sure that the data has the standard orientation:
fslreorient2std ds001506/sub-01/ses-anatomy/anat/sub-01_ses-anatomy_T1w.nii.gz T1w_reoriented.nii.gz
We are ready to go! It is just a matter of firing streamlit up:
streamlit run quick_stripper.py
